Table of Contents
Overview
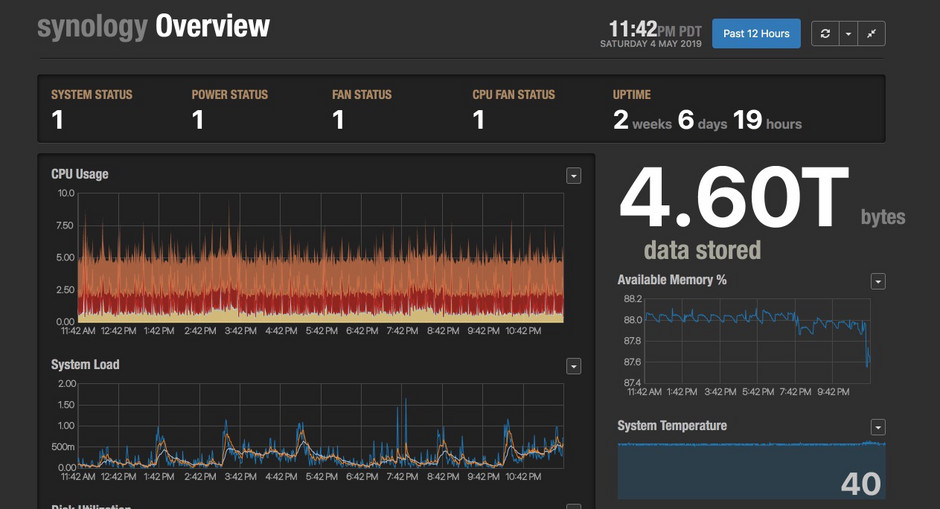
With an always-on home server storing and serving access to all my media, of course I'm going to set up to store and graph operational time-series metrics on it.
Docker Install
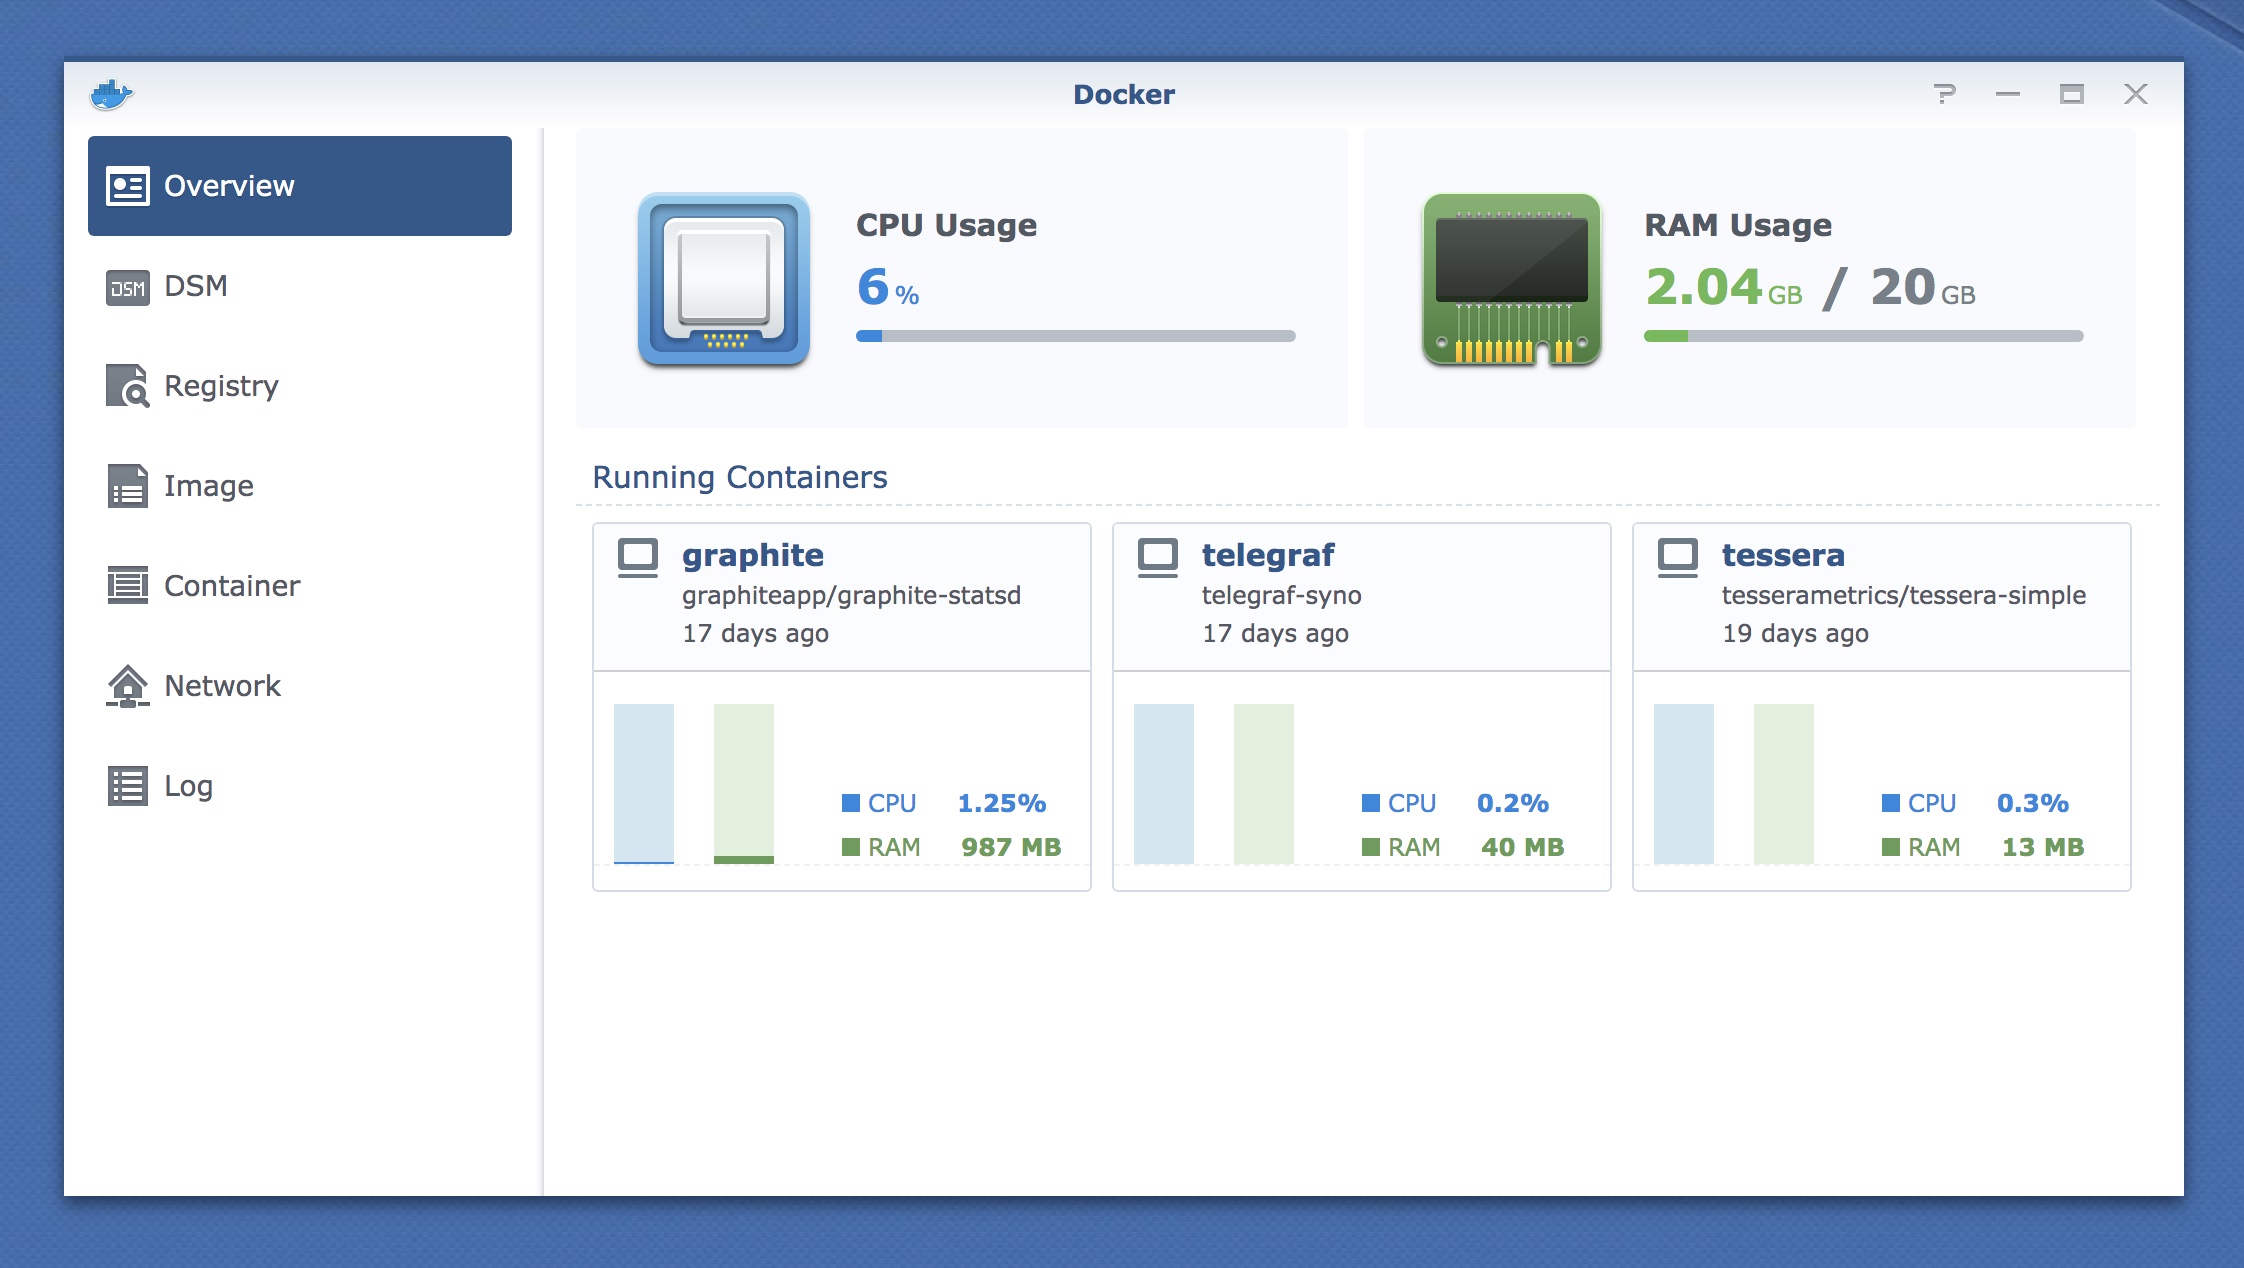
Synology's DSM operating system provides an easy one-click install
option for setting up Docker itself, through their Package Manager. It
also happens to include one of the nicest UIs I've seen for Docker, if
you prefer to manage things through a UI. I find it occasionally
helpful, but I generally ssh into my synology and use the command
line (zsh forever!).

What to run?
For dashboards, Grafana is probably the most well-rounded open-source dashboard system for time series metrics around, but for this I'm going to run my own open-source dashboard system, Tessera. I recently started updating it again, and I have more long term plans for enhancing both the front-end and the server, so it makes sense to use it for my day-to-day.
For the time series database, Tessera currently only supports Graphite, so that's what I'm using.
For collecting metrics, it's hard to beat telegraf as an all around reliable Swiss Army knife of collection agents, with support for many sources and many storage servcices.
Setting up the Containers
You can set everything up manually with the docker command line one
container at a time, or capture a multi-container setup in a
declarative form using an orcestration utility like
docker-compose. I initially set up the containers with the CLI to
debug them (over & over), then captured the entire configuration in a
docker-compose file.
Host Storage
Containers are inherently transient - everything persistent should be
stored either in a docker volume, or on the filesystem of the host,
mapped into the containers. I chose to put all my monitoring data at
/volume1/monitoring on the Synology host. This is a share I've set
up so I can easily change the config files remotely without ssh'ing
into the box.
Network & Volumes
First define a volume for Graphite storage, and a named network for the monitoring containers to share.
version: '3'

networks:
  monitoring:
    driver: bridge

volumes:
  graphite-storage:
Services
Graphite
This is pretty straightforward - use the volume declared above for storage, and map all the Graphite ports into a specified range. I've set it to use 8100 for the primary Graphite web app port, and mapped all the other open ports into the 81xx range as well.
  graphite:
    container_name: graphite
    image: graphiteapp/graphite-statsd
    restart: always
    ports:
      - "8100:80"
      - "8103-8104:2003-2004"
      - "8123-8124:2023-2024"
      - "8125:8125/udp"
      - "8126:8126"
    volumes:
      - graphite-storage:/opt/graphite/storage
    networks:
      - monitoring
Telegraf
Telegraf requires that quite a few things be mapped from the host into the container.
-
Mapping the
docker.socksocket into the container allows telegraf to monitor Docker, and record stats on overall Docker usage and per-container metrics. - Synology exposes lots of data via SNMP, so we're also mapping the Synology MIB files in for telegraf to read
-
Mapping various host filesystem paths in for telegraf to
monitor. Telegraf will get CPU, memory, disk, etc... stats from the
mapped
/procfilesystem - Finally, map the config file, stored on the docker host
Custom Metrics
I built a custom Docker container to run for telegraf, which adds a
simple shell script to run via the [[inputs.exec]] input to gather some custom metrics.
FROM telegraf

COPY metrics.sh /metrics.sh
See below for what's in the custom metrics, and here's the
docker-compose.yml section for telegraf:
  telegraf:
    container_name: telegraf
    image: telegraf-syno
    restart: always
    volumes:
       - /var/run/docker.sock:/var/run/docker.sock
       - /usr/share/snmp/mibs:/usr/share/snmp/mibs
       - /etc/snmp/snmpd.conf:/etc/snmp/snmpd.conf
       - /:/hostfs:ro
       - /etc:/hostfs/etc:ro
       - /proc:/hostfs/proc:ro
       - /sys:/hostfs/sys:ro
       - /var/run/utmp:/var/run/utmp:ro
       - ${MONITORING_ROOT}/conf/telegraf/telegraf.conf:/etc/telegraf/telegraf.conf
    environment:
      HOST_ETC: /hostfs/etc
      HOST_PROC: /hostfs/proc
      HOST_SYS: /hostfs/sys
      HOST_MOUNT_PREFIX: /hostfs
    networks:
      - monitoring
Tessera
Tessera's UI fetches data directly from Graphite in your browser, so it has to be pointed to the exposed graphite port on the Synology's hostname. A future container repackaging tessera will handle proxying that data to eliminate that, and more long-term my plans for Tessera include handling the metrics queries on the backend instead of in the browser.
Because it's under heavy development, I tend to run Tessera locally instead of on the Synology.
  tessera:
    container_name: tessera
    image: tesserametrics/tessera-simple
    restart: always
    ports:
      - "8400:5000"
    environment:
      GRAPHITE_URL: "http://riptalon.local:8100"
    networks:
      - monitoring

Telegraf Config
Telegraf has a very extensive
set of inputs,
which are all self-documenting through a generated .conf file, so
I'm not going to go over most of them here, just the Synology-specific
parts.
SNMP
Setting up an SNMP config for all the points to be pulled is pretty tedious, so I mostly copied it from this reddit thread. You will need to enable SNMP on your Synology, of course.
Media Indexing
When you copy photos and videos to the Synology, it will index them
for the Photo Station or Moments apps to display, which can take quite
a while with a lot of data (it took about 5 days to index my photo
collection). I wanted to monitor that progress, which can be tracked
by some files in /var/spool on the Synology. Those are mapped into
the telegraf container as /hostfs/var/spool.
#!/bin/sh

input_photo=/hostfs/var/spool/conv_progress_photo
input_video=/hostfs/var/spool/conv_progress_video
input_index_queue=/hostfs/var/spool/syno_indexing_queue

total=$(cat "$input_photo"|grep 'total='|cut -f2 -d"=")
total_thumb=$(cat "$input_photo"|grep 'total_thumb='|cut -f2 -d"=")
completed=$(cat "$input_photo"|grep 'completed='|cut -f2 -d"=")
completed_thumb=$(cat "$input_photo"|grep 'completed_thumb='|cut -f2 -d"=")

time=$(date +%s)

echo "synoindexer.photo.completed $completed $time"
echo "synoindexer.photo.completed_thumb $completed_thumb $time"
echo "synoindexer.photo.total $total $time"
echo "synoindexer.photo.total_thumb $total_thumb $time"

total=$(cat "$input_video"|grep 'total='|cut -f2 -d"=")
completed=$(cat "$input_video"|grep 'completed='|cut -f2 -d"=")

echo "synoindexer.video.completed $completed $time"
echo "synoindexer.video.total $total $time"
This grabs stats on how many photos and videos have been indexed and generated thumbnails for, and how many are remaining. It only reports non-zero data while indexing is in progress. I'm simply outputing to stdout in Graphite line format, which is handled by this telefraf input config:
[[inputs.exec]]
  commands = ["/metrics.sh"]
  templates = ["measurement.measurement.field"]
  data_format = "graphite"
The metrics.sh file is simply built into a custom Docker image
derived from the official telegraf image.