Table of Contents
Passive Metrics Collection from the JVM
When I worked at Urban Airship, we had a metrics stack composed of several distinct pieces that worked together to collect and display metrics in a reasonably elegant manner. Back-end services were primarily written in Java, where we used Coda Hale's Metrics library (if you're on the JVM platform, why would you use anything else?).
To get those metrics out of each service instance, we exposed them from an HTTP endpoint and used a collector to poll them periodically and ship them off into our graphite cluster (and if you want to know how to set up a graphite cluster, I highly recommend reading Clustering Graphite). This is a nice way of collecting metrics, as your services don't need to know anything about your metrics stack - they just need to passively expose the data for collection.
The HTTP endpoint that exposed the metrics as JSON data was implemented by a JVM agent with an unfortunate acronym that it only had for historical reasons. A colleague hacked a simple UI into it that let you chart live metrics from a single process. That's extremely useful when running a service in development, or an isolated environment without a full metrics collection stack.
Metrics in Go
At my current job at Anki, we write our services in Go. Not long after I arrived there, I was pleased to find that there's a very good Go port of the Coda Hale metrics library, rcrowley/go-metrics, with built-in support for exposing those metrics using the expvar package's debug HTTP handler.
go-metrics-charts
Despite the ease of setting up local dev stacks with tools like
docker-compose these days, it's still a pain to have to set up a whole
metrics stack to view metrics while developing a service on your
laptop (and sometimes you just don't have the RAM to run that many
containers...), and JSON sucks for humans. So this past weekend I
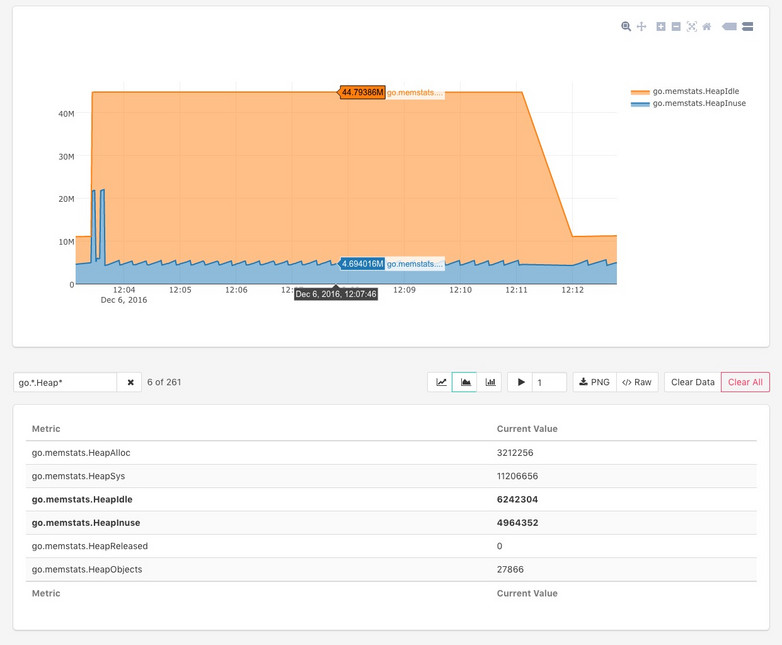
hacked together a quick Go version of that metrics live view,
compatible with the go-metrics library.
The UI will be registered at /debug/metrics/charts. Each load of the
page lets you render a single chart, with any number of exposed
metrics. It's got basic options for line, stacked area, or bar charts,
pausing/resuming the automatic data collection, setting the refresh
period, and exporting the chart as a PNG file. The metrics list can be
filtered with regular expressions.
Despite being a Go library, the code is mostly HTML and Javascript, with the source files embedded using go-bindata. Charts are rendered with plotly.js at present, and all the third-party dependencies are loaded from cdnjs to keep the embedded size down.
ES6 without Babel!
One of the exciting things about this was realizing that, since this is a developer tool and I don't care about supporting old browsers, I could write all the Javascript in native ES6 and not have to transpile a damn thing with Babel. It's got classes, promises, arrow functions, block-scoped variables, and more.
Unlike my other metrics projects, Tessera, which was built with Bootstrap, I used the more recent CSS framework bulma, which uses flexbox for layout, and results in more compact markup than Bootstrap 3 does.
If you're using go-metrics, go give the UI a look
on github!
